Metrics API
Metrics can be used to track how Watchtower behaves over time.
To use this feature, you have to set an API token and enable the metrics API,
as well as creating a port mapping for your container for port 8080.
Note
You can enable both the metrics API and the update API simultaneously by using both --http-api-metrics and --http-api-update flags.
Warning
Enabling the metrics API with port mappings will automatically disable Watchtower's self-update functionality to prevent port conflicts during container recreation. See Updating Watchtower for more details.
The metrics API endpoint is /v1/metrics and provides Prometheus-compatible metrics. This is separate from the /v1/update endpoint which triggers updates and returns JSON results.
Note
The /v1/metrics endpoint only accepts GET requests. Requests with other HTTP methods will receive a 405 Method Not Allowed response.
Available Metrics
| Name | Type | Description |
|---|---|---|
watchtower_containers_scanned |
Gauge | Number of containers scanned for changes during the last scan |
watchtower_containers_updated |
Gauge | Number of containers updated during the last scan |
watchtower_containers_failed |
Gauge | Number of containers where update failed during the last scan |
watchtower_containers_restarted_total |
Counter | Number of containers restarted due to linked dependencies since watchtower started |
watchtower_containers_skipped |
Gauge | Number of containers skipped during the last scan |
watchtower_scans_total |
Counter | Number of scans since watchtower started |
watchtower_scans_skipped_total |
Counter | Number of skipped scans since watchtower started |
Example Prometheus scrape_config
scrape_configs:
  - job_name: watchtower
    scrape_interval: 15s
    metrics_path: /v1/metrics
    bearer_token: demotoken
    static_configs:
      - targets:
        - 'watchtower:8080'
Replace demotoken with the Bearer token you have set accordingly.
Demo
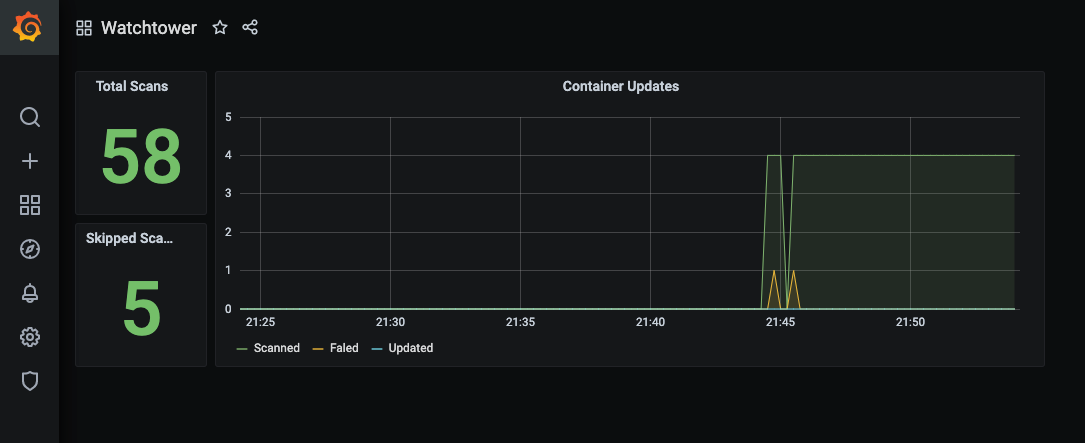
The repository contains a demo with prometheus and grafana, available through /examples/metrics/docker-compose.yml. This demo
is preconfigured with a dashboard, which will look something like this: